The Heating Log Is the First Diagnostic Tool: Reading Six Months of Smart Thermostat Data
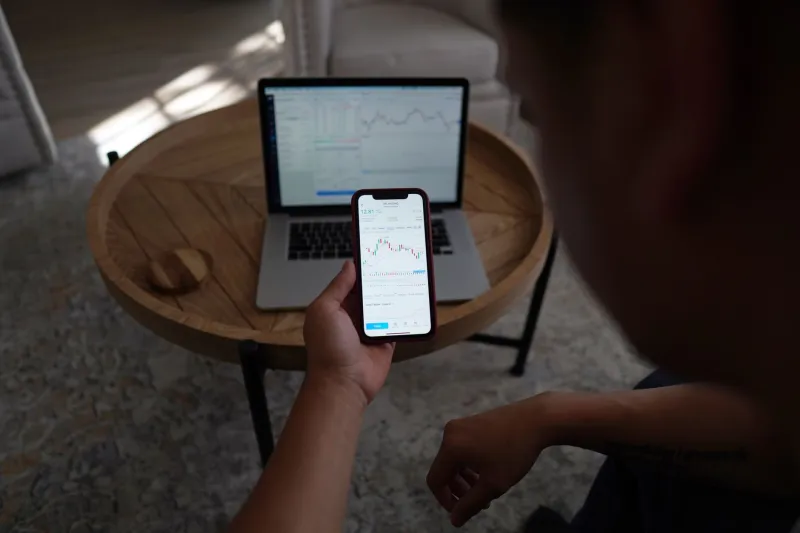
Smart thermostats and smart TRVs are often bought to solve a problem that the existing system has already recorded. Before adding another controller, valve or sensor, a UK homeowner can export six months of heating history and read it as a diagnostic log. The exercise is not glamorous, but it is inexpensive, and it turns a vague complaint about cold rooms or high bills into a set of testable questions.
Export the evidence before shopping
Start with the data the system already holds. A useful export should include thermostat setpoint changes, measured room temperature, call-for-heat events, boiler firing or cycling records where available, TRV valve positions, schedule changes and any occupancy or geofencing events. Some platforms provide a CSV download; others require a support request. Ask for the finest practical granularity, usually five or fifteen minutes, and confirm whether timestamps are local time or UTC.
Do not clean the file immediately. Keep the original export, then make a working copy. Note the firmware version, app version and any hardware changes during the period. A sensor moved in January or a TRV replaced in March can explain a step change that would otherwise look like a fault. Six months is a sensible minimum because it captures shoulder-season behaviour as well as colder weather, but longer records are better if the platform allows them.
Put the weather back into the numbers
Gas consumption alone is not a fair measure of performance. A colder month will use more energy without the heating system being inefficient. Heating degree days provide the missing context. For UK domestic heating, degree days are commonly calculated against a base temperature of 15.5°C: each day, the difference between the base and the mean outdoor temperature is accumulated. Local datasets are available from weather services and degree-day suppliers.
Plot daily gas consumption against daily heating degree days. A roughly linear relationship is expected. The interesting points are the outliers: days when gas use is high but degree days are low, or days when comfort complaints coincide with ordinary weather. If consumption rises while degree days are flat, look for schedule changes, increased hot-water use, a stuck valve or a boiler that is cycling more than it should.
Schedule drift and the setpoint staircase
A healthy schedule produces a stable pattern of setpoint changes. Schedule drift appears as repeated manual overrides at the same time of day, permanent holds that quietly become the new normal, or a setpoint that creeps upward through the season. Count setpoint changes per week. A handful is normal; dozens suggest the schedule does not match the household.
Occupancy mismatch is closely related. Many schedules were written for a pre-pandemic routine and never revised. The log may show bedrooms heated all day while the house is empty, or a living room allowed to cool before the evening occupancy begins. Compare call-for-heat events with occupancy records, if available, or with a simple diary of when rooms are used. The aim is not to heat only occupied rooms at all times, but to avoid heating rooms that are routinely empty.
The short-cycling signature
Short cycling is visible as frequent boiler firing for short durations, often with room temperatures hovering near setpoint. Smart TRVs can contribute if they close down flow and leave the boiler with a small water volume to heat. The log may show call-for-heat switching on and off in quick succession, or boiler cycles per hour rising while demand is modest.
This is a pattern, not a diagnosis. Short cycling can also come from an oversized boiler, a faulty thermostat, a bypass issue or a system that is not hydraulically balanced. The value of the log is that it narrows the question. A heating engineer can then check modulation, flow and return temperatures and control behaviour with evidence rather than guesswork.
Room-by-room call-for-heat patterns
TRV records are particularly useful. Look for rooms that call for heat while unoccupied, rooms that never reach setpoint, and one room that dominates demand. A spare bedroom calling every morning may be on a copied schedule or held open manually. A living room that runs continuously may have an undersized radiator, a heat-loss problem or a TRV that is not controlling properly.
Compare valve position with room temperature and schedule. A valve that is open when the room is already warm suggests a calibration or commissioning issue. A valve that is closed during occupied hours suggests the schedule is wrong or the room is being heated by another source. These are inexpensive checks before any hardware purchase.
A practical checklist
- Export at least six months of data and keep the original file.
- Record firmware, app and hardware changes during the period.
- Align timestamps and check for missing days.
- Obtain local heating degree days for the same period.
- Plot daily gas use against degree days and mark outliers.
- Count setpoint changes per week and list the most common overrides.
- Flag rooms calling for heat while routinely unoccupied.
- Count boiler cycles per hour during mild and cold spells.
- Compare weekday and weekend patterns separately.
- Note any room that never reaches its setpoint.
- Write a one-page summary of patterns, not conclusions.
- Use that summary to brief an installer, engineer or energy adviser.
What the log cannot tell you
The log does not measure fabric heat loss, boiler efficiency or comfort. It cannot prove that a wall is uninsulated or that a radiator is correctly sized. It can, however, show where to look next. A thermal camera survey, an airtightness check or a boiler service may still be necessary. The difference is that the investigation begins with evidence from the home rather than with a new gadget.
In the 2026 heating season, the most useful smart heating upgrade may be a careful reading of the system already installed. Export the history, compare it with the weather, and let the patterns set the priorities.