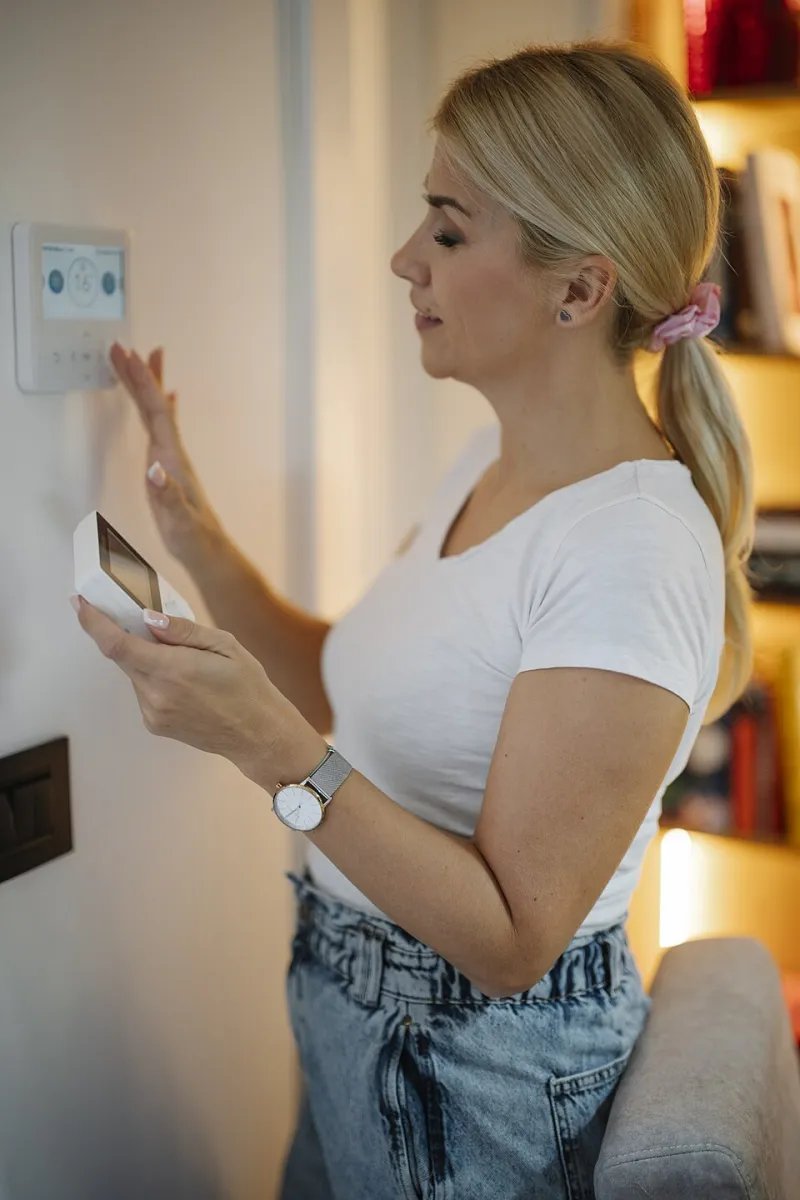
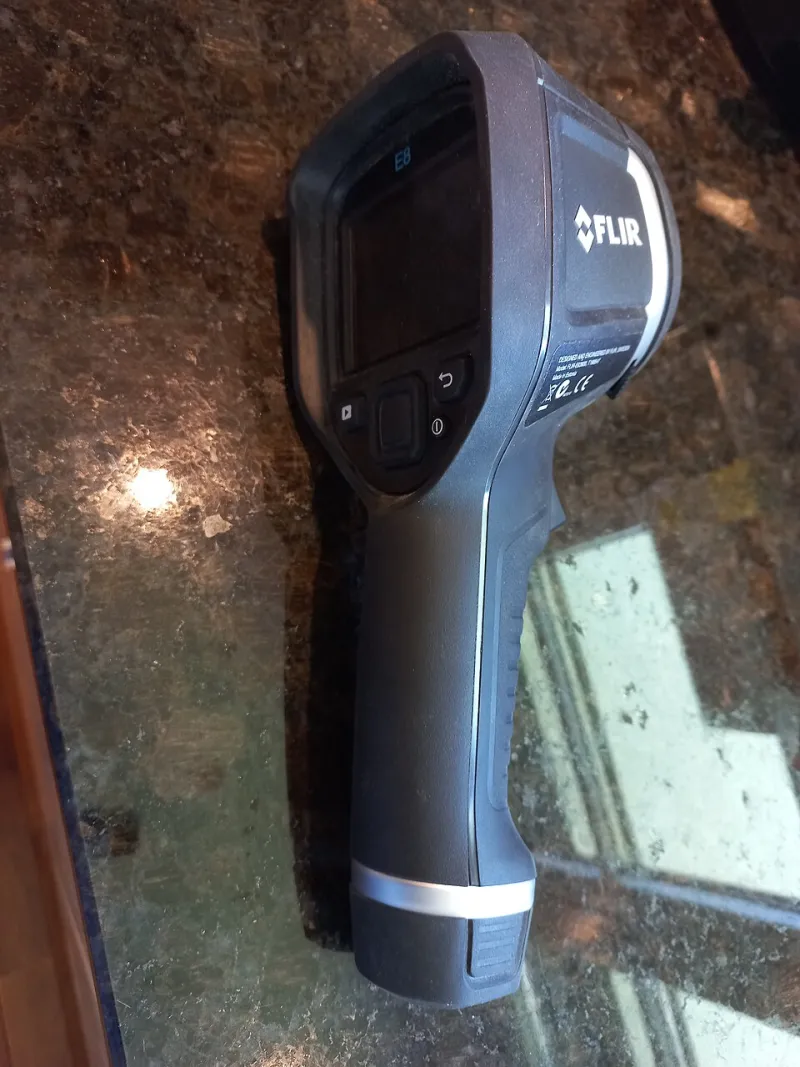
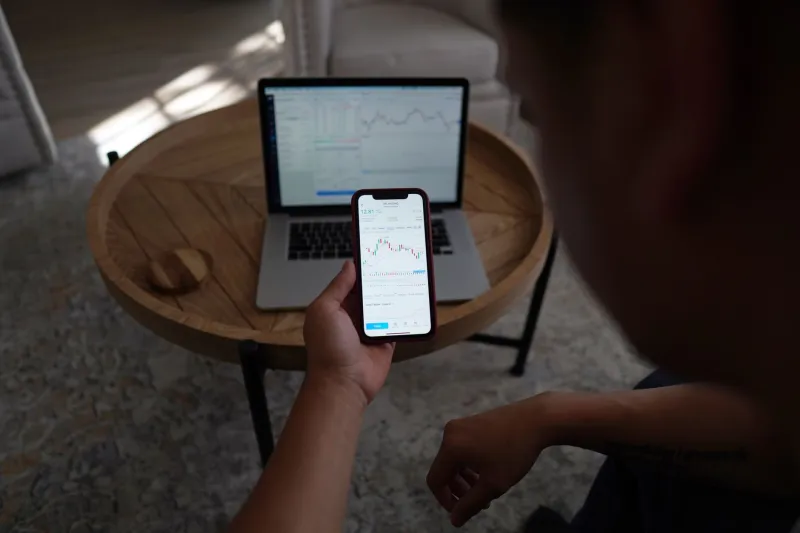
The Meter Is a Witness, Not a Verdict: Half-Hourly Data in a UK Heating Investigation
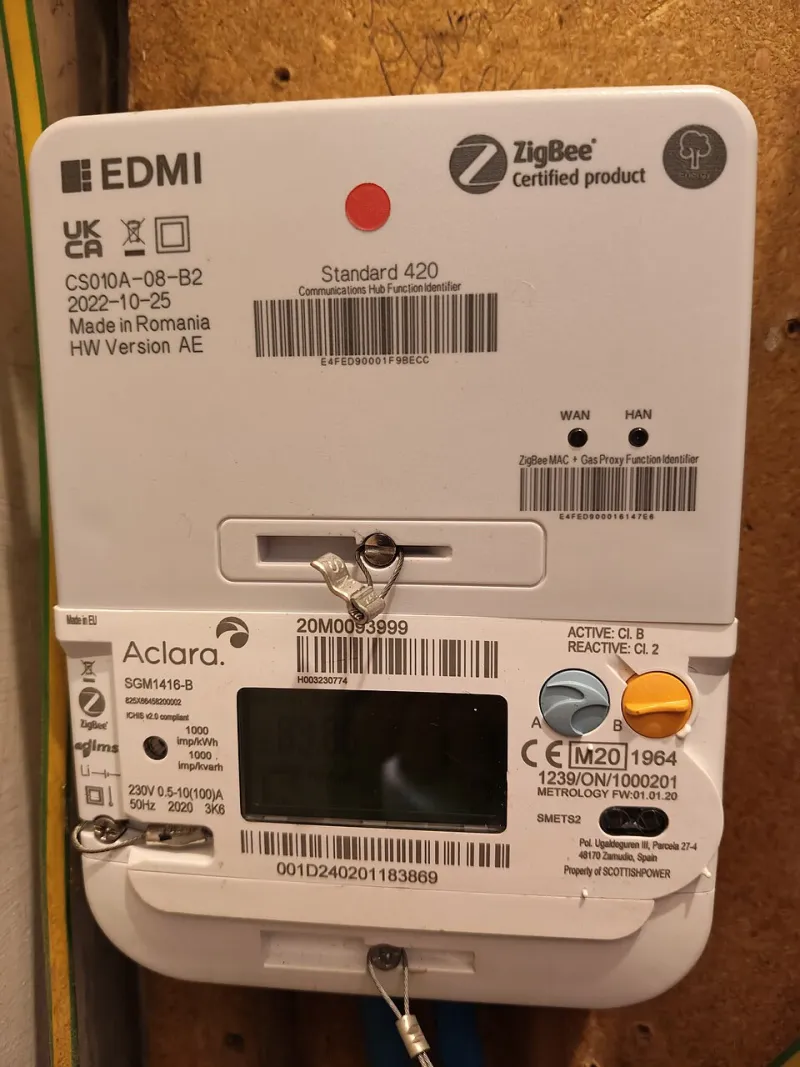
Photo: SpicyPhoto, CC0, via Wikimedia Commons
Smart meter data arrives with an air of authority. It is time-stamped, numeric and produced by a device installed specifically to measure energy. It is tempting to treat a half-hourly export as a thermal survey in tabular form. It is not. The meter is a witness to electrical demand, not a camera for heat. Used carefully, however, it is an excellent first witness: it can tell a UK homeowner when a boiler, heat pump, immersion heater or secondary electric heater is active, and it can frame the questions that a thermal camera and a physical walkthrough should answer.
What half-hourly data actually records
For most domestic electricity supplies, a smart meter records consumption in half-hourly intervals and makes that data available through the supplier, an in-home display or a consumer access device. Resolution is the first limitation. A 30-minute figure is an average, not an instantaneous reading. A boiler pump that runs for six minutes every half hour, a heat pump that modulates gently, and an immersion heater that switches on and off within the same interval may all produce similar-looking blocks. The meter records kilowatt-hours, not room temperature, flow temperature, surface temperature or comfort.
Gas adds another layer of interpretation. Smart gas meters can provide consumption data, but access and granularity vary by supplier and meter configuration. Even where half-hourly gas figures are available, they describe fuel input, not heat delivered. For a gas boiler, the electricity trace often reveals only the auxiliary load: pump, fan, controls and perhaps a condensate pump. That electrical shadow is useful, but it is not a combustion analysis.
Standby draw: the baseline that should not be there
Begin with the quietest period. Export at least seven days of half-hourly data, including a mild night and a cold night, and identify the base load between midnight and 05:00. A persistent draw of 100–300 W may be ordinary—broadband, refrigeration, alarms, heating controls—but it can also include a towel rail left on, a heat pump in standby, a pump in a sealed system, or an immersion heater on a timer that no one has revisited since the last tariff change.
The diagnostic value lies in comparison. If the overnight floor rises at the same time as the heating season, the heating system is the likely contributor. If it rises after a tariff switch, check for a legacy boost schedule. A thermal camera cannot see standby electricity, but it can confirm the consequence: a warm cylinder, a hot towel rail or a pump body that should be cool. The meter points; the camera confirms.
Boiler cycling and the electric shadow
A gas boiler’s electrical demand is modest compared with its heat output, but it is patterned. On a cold morning, the pump may run before ignition, the fan may ramp, and the controls may hold the burner in a series of short firings. In half-hourly data this can appear as a modest lift in consumption—perhaps tens to a few hundred watts—rather than a dramatic spike. The trap is to read that lift as a measure of heat. It is not. A long, low electrical trace may indicate steady modulation; a series of sharp blocks may indicate cycling, but the meter cannot distinguish efficient condensing operation from short-cycling caused by oversized output or restrictive emitter circuits.
Pair the pattern with a thermal check at the same time. Measure flow and return pipe temperatures at the boiler, or use a thermal camera on the pipes and radiator panels. If the meter shows frequent short bursts while the flow temperature climbs quickly and the return stays cool, the system may be cycling before the emitters have absorbed heat. If the electrical trace is steady but rooms remain cold, the problem may lie in heat loss or balancing rather than boiler control.
Immersion heaters and direct electric heating
Direct electric heating is where half-hourly data becomes most legible. A 3 kW immersion heater draws roughly 1.5 kWh in a half-hour interval; a 2 kW panel heater draws about 1 kWh. These are large, distinctive blocks that stand out against a domestic base load. Compare their timing with occupancy and with the heating programme. A block at 04:00 may be a legitimate off-peak immersion boost; a block at 17:00 may be a top-up caused by a cylinder thermostat set too low or a hot-water schedule that no longer matches demand.
Thermal imaging adds the verification the meter lacks. A cylinder should be warm at the top and cooler at the base; a direct electric radiator should show an even surface pattern rather than a single hot stripe. If the meter records a 3 kW block but the cylinder surface remains tepid, the evidence points to a faulty element, a stuck thermostat or a diverter valve issue rather than a hot-water demand problem.
Cold-morning recovery
The most useful domestic pattern is the cold-morning ramp. In a home with an electric heat pump or direct electric heating, the half-hourly trace should rise when the schedule calls for warmth and fall when the setpoint is met. Record the time taken to move from overnight setback to comfort temperature, and compare it with the external temperature for the same morning. A slow recovery on a mild morning suggests an undersized emitter circuit, a conservative weather-compensation curve or a control fault; a fast recovery followed by a long plateau may suggest oversized output or a thermostat placed in a favourable spot.
For gas-heated homes, the electrical trace is a proxy at best. The boiler may run for hot water, the pump may overrun, and frost protection may operate without any call for heat. Use the gas data where available, and use room-temperature logging to separate heating from hot water. Then take a thermal walkthrough at the same hour: external walls, window reveals, loft hatches and radiator surfaces will show where the delivered heat is going.
Where the meter misleads
Half-hourly data is blind to short cycling within the interval, to zone-by-zone demand, and to the difference between comfort and setpoint. It is also easily confused by solar photovoltaic generation, battery storage, electric vehicle charging and legacy Economy 7 timers. Missing intervals, estimated reads and supplier data latency can create false patterns. And a meter cannot see emissivity, air movement or radiant asymmetry—the very things a thermal camera is designed to reveal.
The sensible method is sequential. Use the meter to locate events in time, use room-temperature logs to confirm comfort, and use thermal imaging to locate the physical cause. The meter is the index; the camera is the illustration; neither is the whole report.
A practical pairing for UK homes
Export a fortnight of half-hourly data, annotate it with outdoor temperatures and household occupancy, and mark the heating schedule. Identify the overnight base load, the morning ramp, any large direct-electric blocks and any unexpected daytime activity. Then repeat the thermal walkthrough at those exact times. Check the cylinder, the boiler casing and pipes, the radiator panels and the colder external walls. The result is not a verdict but a defensible sequence of evidence—appropriate for a homeowner, a landlord or an installer preparing a handover.
As the 2026 heating season progresses, the smart meter will remain the most accessible energy record in the home. It deserves to be read closely. It does not deserve to be mistaken for a thermal camera.